Google

Friday, June 23, 2006

Does PE only mean Per Share Price/ Earning?

What does PE say- Only price paid for earning on a per share basis? Or additional important information for which it is regarded as the de facto investment decision making indicator.

Let’s get back to basics. If we value a share assuming:

Next year dividend as D1, perpetual growth rate of g and cost of capital based on desired capital structure of k. Then current stock price can be calculated as:

Po= D1/ (k-g)

Dividing both sides by estimated Earning Per Share for the next year (E1)

Po/E1= D1/E1/ (k-g)

Remember, Po/E1 is a typical forward PE ratio and Dividend Payout = (D/E)

Forward P/E = Desired Dividend Payout Ratio/ (k-g)

Also, Growth Rate (g) = Retention Rate (rr) * ROE
And, Retention Rate (rr) = 1- Dividend Payout Rate

P/E= Dividend Payout/ [k-(rr * ROE)]

Also, k= {[(I) * (1-t)] * D/(D+E)} + [ke * E/(D+E)], where I= Interest, t= Tax Rate, D= Total Debt, E= Net Worth and ke= Cost of Equity

P/E= Dividend Payout/ [[{I * (1-t) * D/ (D+E)} + {ke * E/(D+E)}] – (rr * ROE)]

(Note: Put special attention on the brackets to avoid any confusion)

Further ROE can be break out into (Dupont model) Post Tax Earning/ Sales (Profitability measure) * Sales/ Assets (Asset utilization measure) * Assets/ Net Worth (Leverage measure)

Hence PE of a stock is affected by the Dividend decision, Financing and Capital Structure decision including cost of equity, Tax Rate consideration; and capital efficiency & profitability of the business. The list might not be exhaustive.

Thus it becomes all important for a finance manager to consider the following while making any financial information to tweak the financial model of the firm impacting the PE ratio.

Higher the dividend pay out ratio will increase the PE but at the same time it lowers the retention ratio as rr=(1-Payout) ,which in turn lowers the growth rate as g=rr* ROE, and thus lowers the PE ratio.

Higher tax rate lowers the cost of capital so increases the PE ratio but at the same time it reduces the ROE according to Dupont model by reducing Earning/ Sales, thus lowering the PE ratio.

Higher profitability, better asset utilization and higher leverage, increase the ROE which increases the growth rate (g) thus increases the PE ratio but at the same time increases the cost of capital too and thus the denominator and decreases the PE ratio.

Capital structure is itself an ocean, so better to be left out from PE discussion. In brief increasing debt level decreases the cost of capital initially but then increases the cost of capital by increasing the default premium on debt and risk premium on equity.

To conclude, PE has what it takes to be a de facto investment decision making ondicator.
The art of war and takeover- A case study

Earlier this year Portuguese number 2 telecom and internet operator Sonaecom put its bid to acquire its larger telecom rival and incumbent Portugal Telecom (PT) to become unrivaled leader at home. Neighbor Spain’s telecom incumbent Telefonica holds around 10% in PT and has a 50:50 JV with PT in prized Brazilian numero uno mobile company Vivo. Telefonica too mulled with the idea of bidding for PT to ultimately get a full hold of Vivo, but later it dropped the idea as it would not have desired to carry the largesse of declining wired telephony in Portugal.

Now with Sonaecom again reiterating its bid for PT, Telefonica is believed to be helping the former to seal the deal by selling its 10% share in PT to Sonaecom. I wondered as to why it did so, and then I remembered a deal in the US telecom market that happened during early 2005. Verizon (then no. 1 in the US telecom market) bid for MCI and Latin American telephone tycoon Carlos Slim agreed to sell his 13% stake in MCI to VZ at a price lower than VZ’s revised upward bid for MCI, to help VZ seal the deal. Later after a year (during early 2006) VZ agreed to sell its stakes in Venezuelan incumbent telephone company CANTV and other telecom assets in Latin America to Mr Slim.

Telefonica is also following Slim’s footstep (has to be as both are fighting for the LatAm dominancy). I believe Telefonica is helping Sonaecom to takeover PT to ultimately bargain for PT’s 50% stake in Vivo, later from it. Vivo is the undisputed mobile telephony leader in Brazil with 33% market share ahead of 25% and 22% held by Italy’s Telecom Italia Mobile (TIM) and Carlos Slim’s owned America Movil’s Claro respectively.

Friday, June 16, 2006

RCVL’s GSM foray- Thinking behind the thought

The indication from Reliance Communication (RCVL) that it is mulling with the launch of GSM network in Mumbai and Delhi, has made flurry in the telecom sector globally from India to the US and forced Mr Paul Jacobs (Head Of Qualcomm) to pay a quick visit to India or may be it’s a coincidence!!!. It made us, the analysts, wonder as to what could be the thinking behind this thought?

RCVL runs both CDMA and GSM technologies in India. While its CDMA network covers most parts of India, its GSM network operates in 8 circles with little more than 2 mn subscribers. This news flow we all know.

Not let’s think why RCVL is thinking of GSM foray in the markets where it operates on CDMA, and would it be positive move at all? Will it cannibalize its own CDMA service or able to gain larger pie? (Let me put a point here that in Kolkata RCVL operates both its network)

The following are my quick arguments which support RCVL possible foray:

Before jumping to the operating and financial analysis lets talk on the psychological front, I feel RCVL’s CDMA telephony is now more associated with price sensitive or users who can compromise on quality for cost or lower strata (lower and lower middle class) people as it offers the lowest price services compromising on quality. It hardly has any corporate clients what Bharti or Hutch have in Mumbai and Delhi. And image makeover is very difficult/ expensive if not impossible. So RCVL is opting for the GSM way.

Now on call quality, CDMA network tries to accommodate more callers in its given bandwidth and provide different code to different set of callers so that other callers in the same bandwidth do not get disturbed. If you are in Germany you will not understand German language so your conversation with fellow Indian in Hindi would not get hindered but you will face lot of clutter ness and disturbance if Germans in your proximity are talking to each other. Same happens in the CDMA network in busy/ high usage areas like Nariman Point, Mumbai and Connaught Place, Delhi. Network disturbance, call drops etc. lead to frustration among the user of CDMA networks.

Spectrum issue, another point to make is that CDMA gets only 1 unit of extra bandwidth if GSM gets 2. So network constraint in CDMA could also be another factor behind this thought. Telecom authority says that RCVL has approached for seeking radio band in GSM space in these two cities.

If you cannot beat them join them, and RCVL would be thinking the same to compete against the GSM operators. Subscribers who want to be in the GSM network only, would not opt for RCVL’s CDMA so it leads to loss of opportunity for RCVL to tap any dejected GSM customer. 80% of Indian mobile market is served by GSM operators in which RCVL has a negligible market share. So, RCVL wants to enter the bandwagon to exploit the GSM market rather than let it go, after flagging its leadership with huge margin in the CDMA space. Telefonica Moviles did the same in Mexico and moved from CDMA to GSM starting from late 2002 and did very well, as 90% of the market was served by GSM operators which include the biggies and my favorite America Movil (AMX).

CDMA is a low cost operator- Myth or reality

If numbers say everything, the above statement is a myth. Look at some data pertaining to global mobile operators. The EBITDA Margins of GSM operators in Europe like of Vodafone, T-Mobile, TIM, Telefonica Moviles average at around 48% as compared to CDMA biggies Verizon’s and Sprint’s (US CDMA operators) of 42%.

While CDMA is cheaper in opex terms but costs higher in capex terms. Network upgrade of CDMA is also costlier as compared to GSM upgrade. And CDMA2000 (2G version of CDMA) can be upgraded to WCDMA (3G version of GSM) as WCDMA also shares CDMA platform. W-CDMA is based on the Direct Spread CDMA technique. In fact Verizon also thought of udgrading itself to WCDMA fromits then CDMA2000 during 2001. SK Telecom of South Korea migrated from CDMA2000 to W-CDMA. Because QUALCOMM’s WCDMA solutions are built on established CDMA experience delivering fully tested, completely integrated technology development costs can be minimized as one moves toward WCDMA 3G networks. So, RCVL would not required to scrap its CDMA network if it wants to upgrade to 3G.

So, to conclude I would say RCVL with its financial muscle is doing the right thing by entering into the GSM space in metros to start with (if at all it comes true) to get an opportunity to exploit the GSM market. Simple fundamental of Economics applies. Positive marginal revenues are always welcome as long as it is higher or equal to marginal cost. RCVL will save up to 40% of its capex and distribution cost while rolling out its GSM service.

Thursday, June 15, 2006

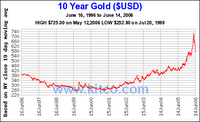
10 year Gold price in USD

Partly supported by dollar depreciation post 2003, gold has come a long way but still far behind its near USD 800 per ounce peak reached in early 80s. After touching 725 level it has corrected sharply and hovering at 560-570 level. Gold is not my expertise so i had just put the 10 year chart on my blog for a quick reference.

Please click on the below chart for a clear view

The art of cajoling the shareholders- A Case study

Shareholders are cajoled in many ways by companies. A company makes loss but it flatters its stakeholders by bonuses, huge dividends, buy backs etc. Vodafone of the UK and biggest mobile operator in the world by revenues,posted its worst ever result of a loss of around $41bn for the year 2005-06, as it is still writing off the huge premium it paid for acquiring Manessman which it acquired for around $188bn during 2001. It attempted the same during 2000 by $94bn bid but was refused by the board of the target!!!

To retain the confidence of already angered and shattered stakeholders it rewarded them with a huge dividend of around $9bn.

KPN, the telecom incumbent of the Netherlands bought back its shares during 2004 and 2005 to give a downward support to its stock price which was becoming a victim of the langushing performance by the company in its fixed line business.

Back at home, Dr Reddy's did the same thing. While the company posted a dissapointing performance for FY 2006, it announced bonus to its shareholders to retain their confidence of which it had been a victim 18 months before.

Thursday, June 08, 2006

On the UAE Markets

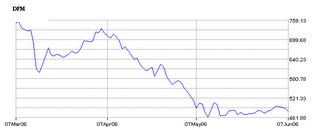
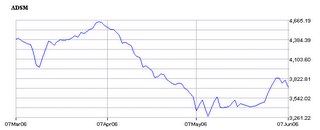
The last two weeks in the DFM and ADSM saw one way rise and then correction. Good news came from the Abu Dhabi pension fund that they perceive the UAE markets as good on valuations. Investors took it positively and the daily turnover in the ADSM which was languishing at around AED 150mn rose sharply to more than AED 1bn in the past few trading sessions. Blue chips like Etisalat and few banks showed some sign of strength. However the rise was short lived and the markets went down during this week and shed most of the rise they had during last week. ADSM which was at 3420 on 25th May touched 3833 on 3rd June before closing today (7th June) at 3597, and DFM was at 473 on 25th May touch almost 500 on 5th June before closing today at 470.

At present level, the UAE markets are at PE of 12-14 with quality stocks at the same PE level. Margins and Cash flows are robust and the balance sheets of good UAE companies’ are not very leveraged to take a hit in case of rising interest rate scenario. Etisalat is having cash surplus and so is Emaar- two heavyweights in the UAE markets.

UAE banks also share the same story. The banks' leverage ratio (Total Assets/ Equity) of 6-10x is not very high as compared to big banks in the markets like The US, UK, or emerging market like India (12-18x) and their NIM is also very good of 3-4% and ROA of 3% (which is infact much better if you compare this with Indian or the US banks). HSBC’s ROA and Leverage is 1.1% and 16.5x, while Bank of America has 1.5% and 12.5x respectively as at 2005 end. Even CAR of local banks are also well above 12% as required by Basel II.

It will take a while to boost the confidence of the investors here, till then I welcome the consolidation phase of the markets with good volume. And my support levels remain the same i.e. 3250 for ADSM and 420-430 for DFM…in the worst case that is.